Police Killings By The Data
To interact with this data, please use this link.
In the spring of 2020, millions of Americans took to the streets of their cities shouting “Black Lives Matter”. The murder of George Floyd by a police officer in May 2020 incited people from all 50 states to engage in protests and riots against systemic racism and police violence in the country, yet the data suggests that little change has been made in the following four years.
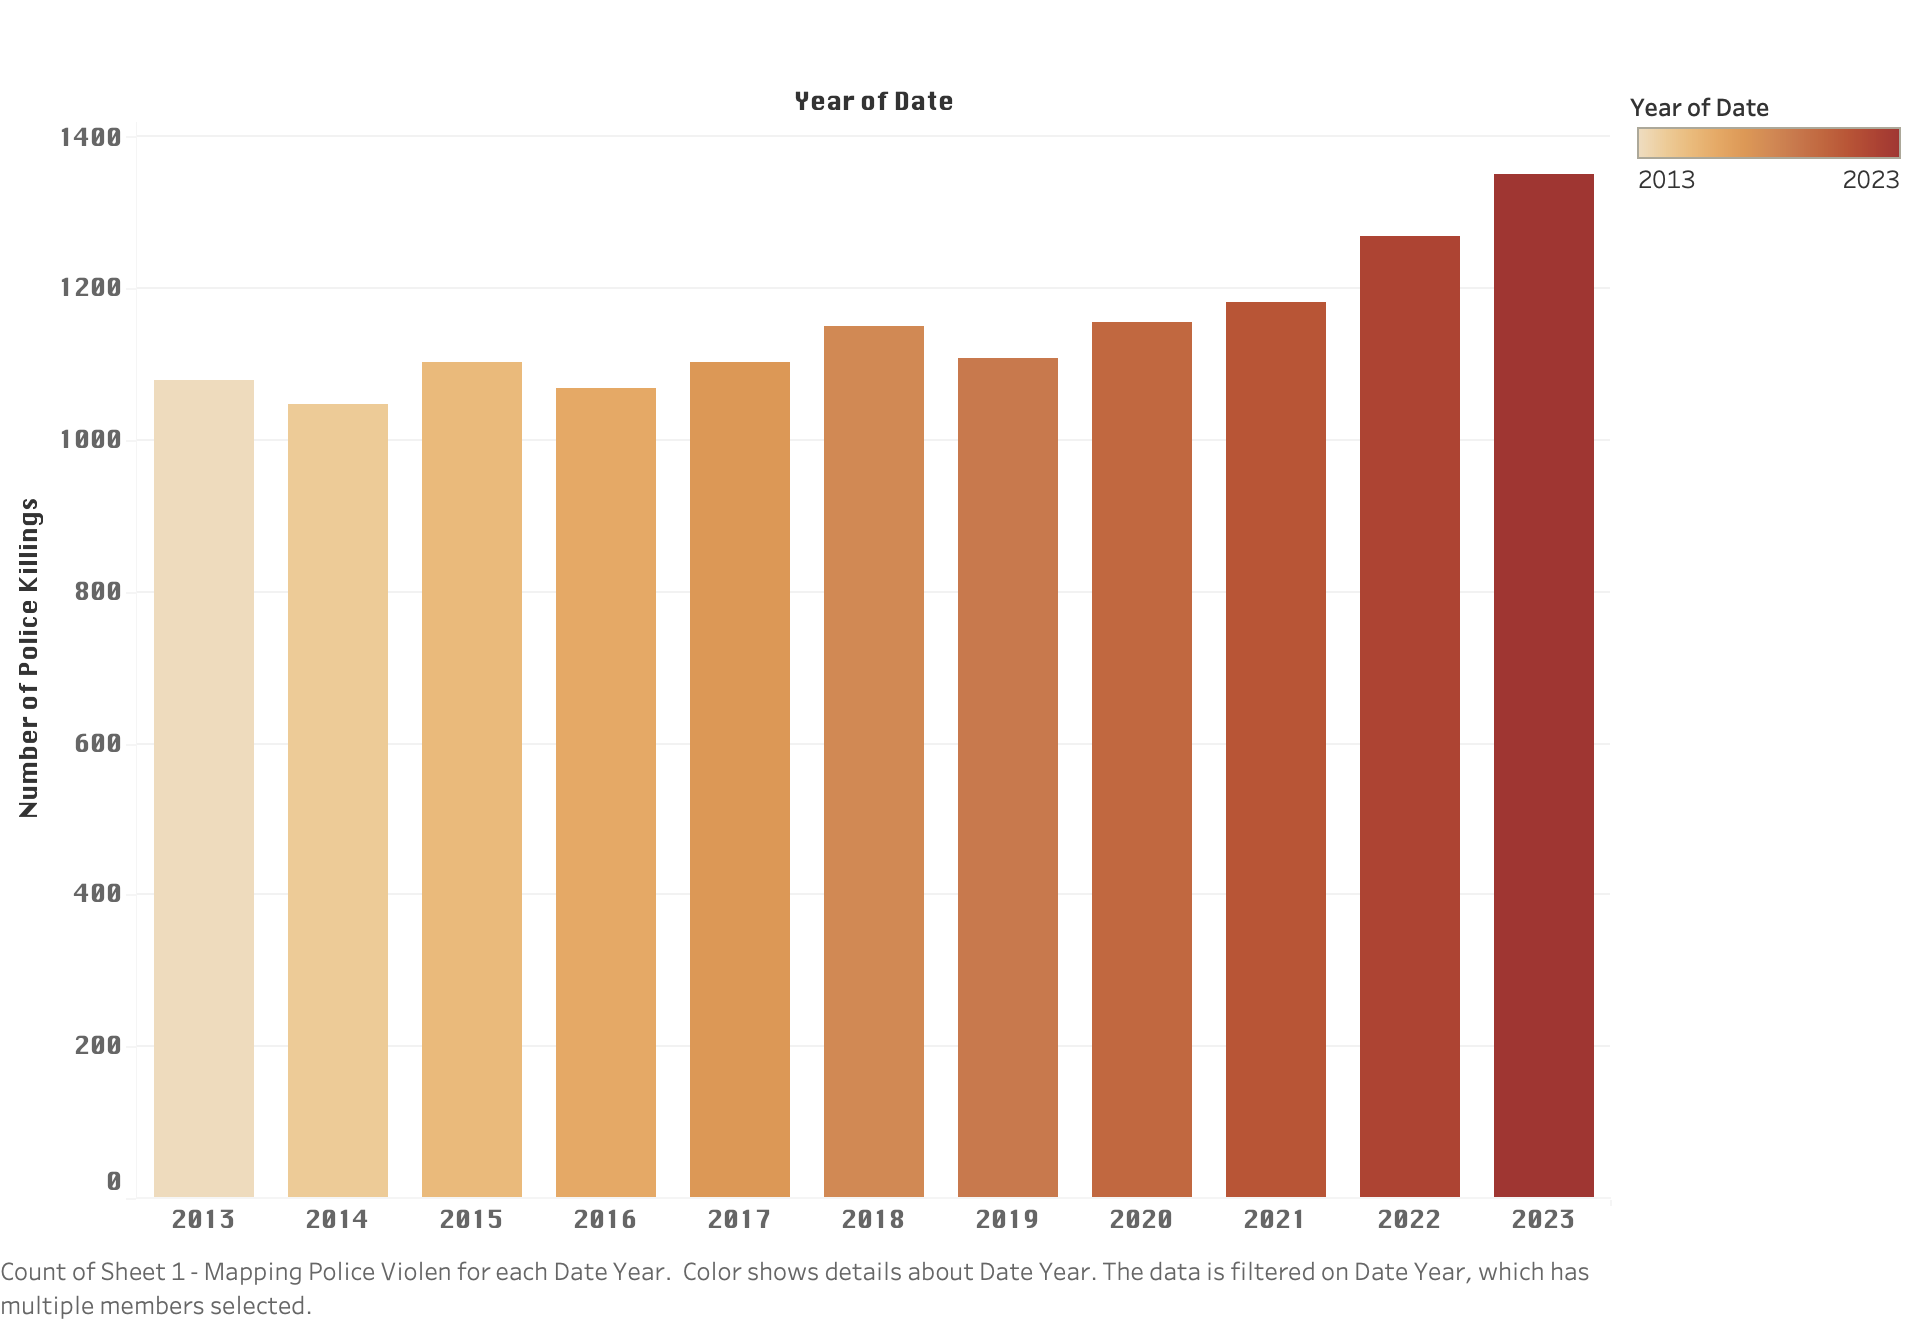
Police in the United States have killed more individuals every year since the Black Lives Matter movement resurged in 2020. In 2023 alone, police officers killed 1,351 individuals. This rate of killings, however, is an issue that is unique to the United States. According to CNN, police in the US kill, shoot, and imprison more people than in any other similar country.

Mapping Police Violence, which is a non-profit research organization, uses public records displaying police killings to make the data more accessible and understandable to the general public. Through their publications, they have made it abundantly clear that Black Americans are 2.9x more likely to be killed by police than white Americans and provide a plethora of visualizations to understand the impact.
Here’s the breakdown of police killings in the United States since 2013:
- 12,904 people have been killed;
- 94.25% of the victims were male, 5.53% were female, and 0.11% of them belonged to a gender minority;
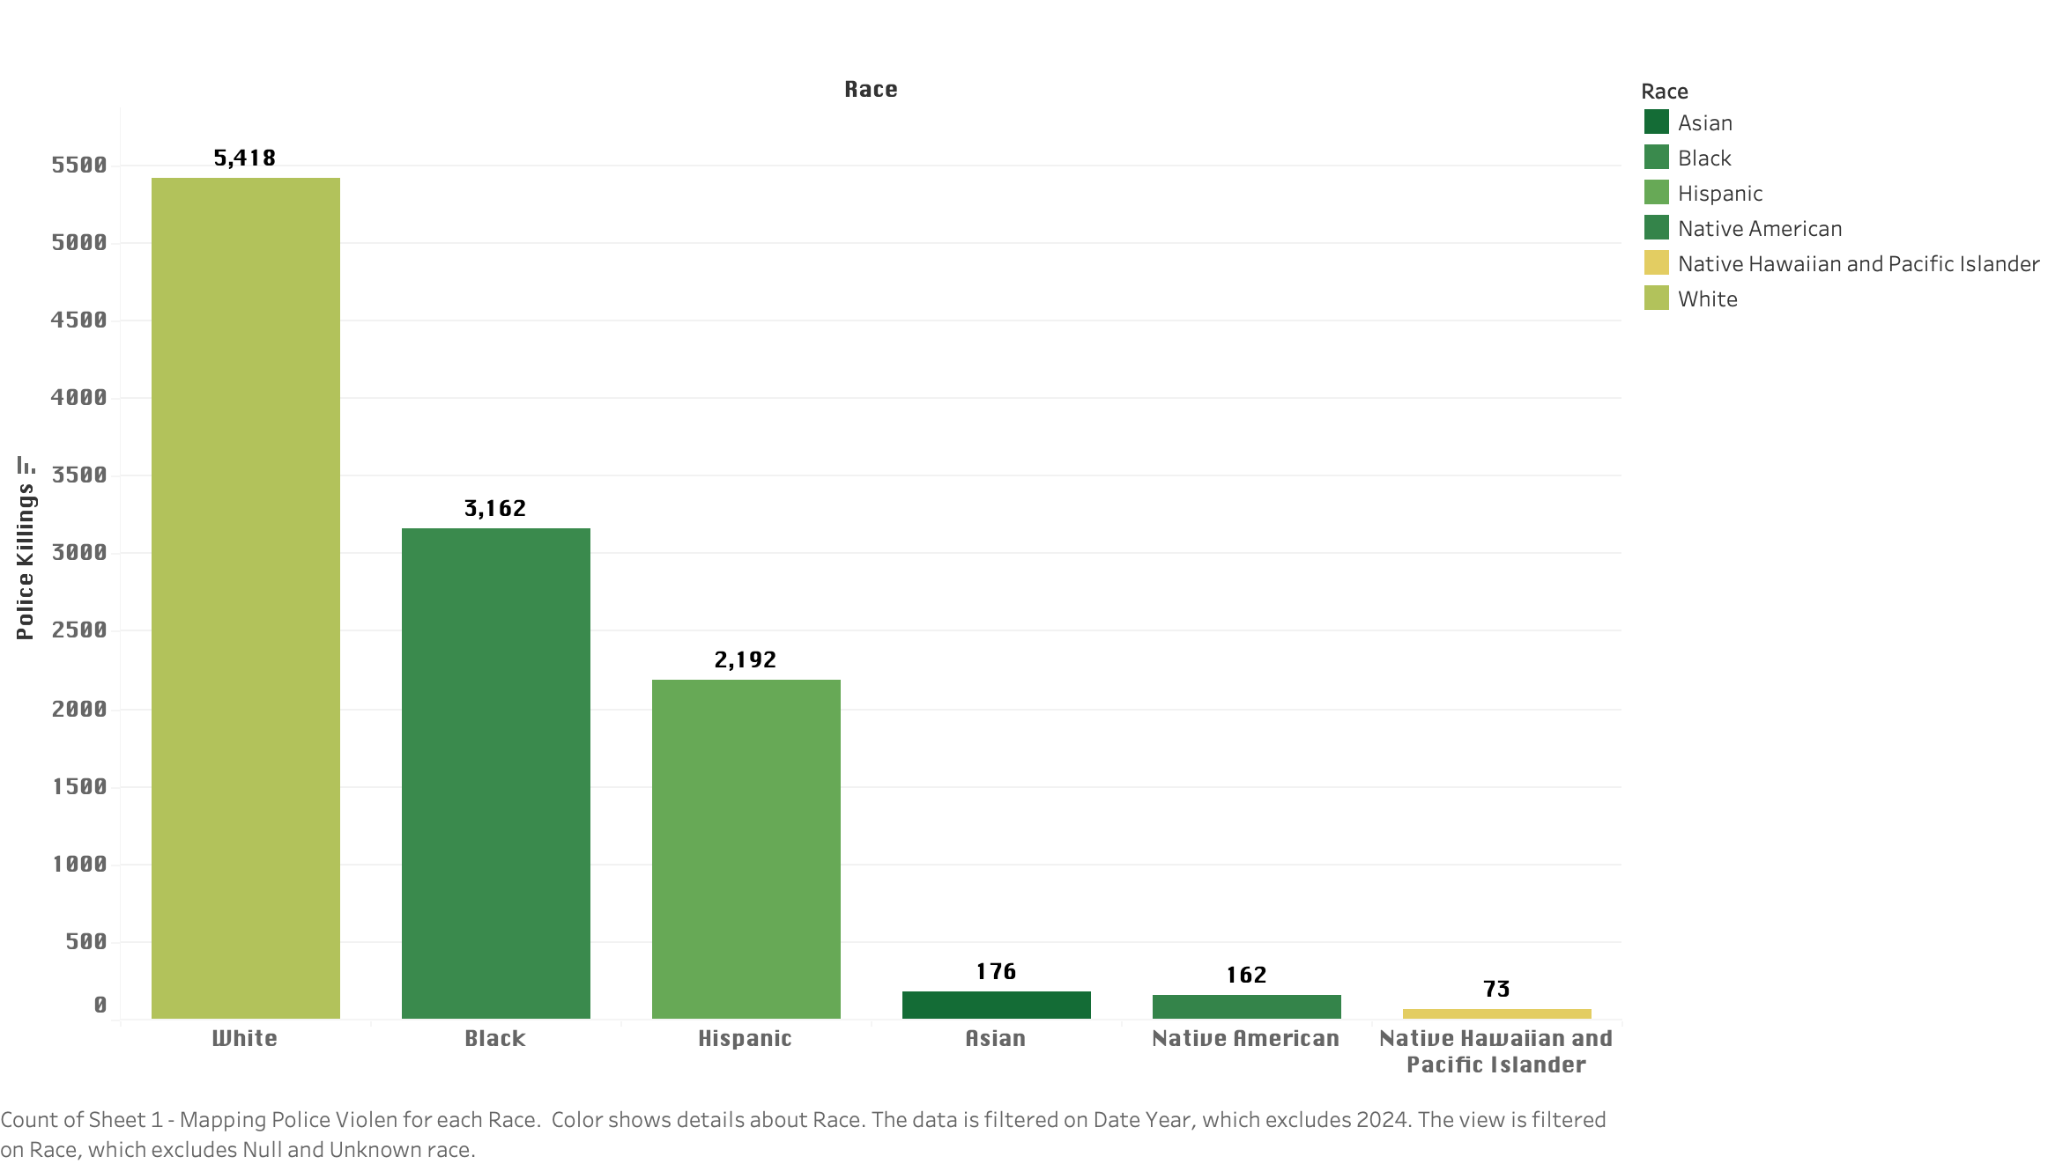
- 42.9% of the victims were white, 24.98% were Black, 17.41% were Hispanic, 1.37% were Asian, 1.263% were Native American, and 11.07% of them were not identified by a race;
- 90.72% of victims were killed by gunshot;
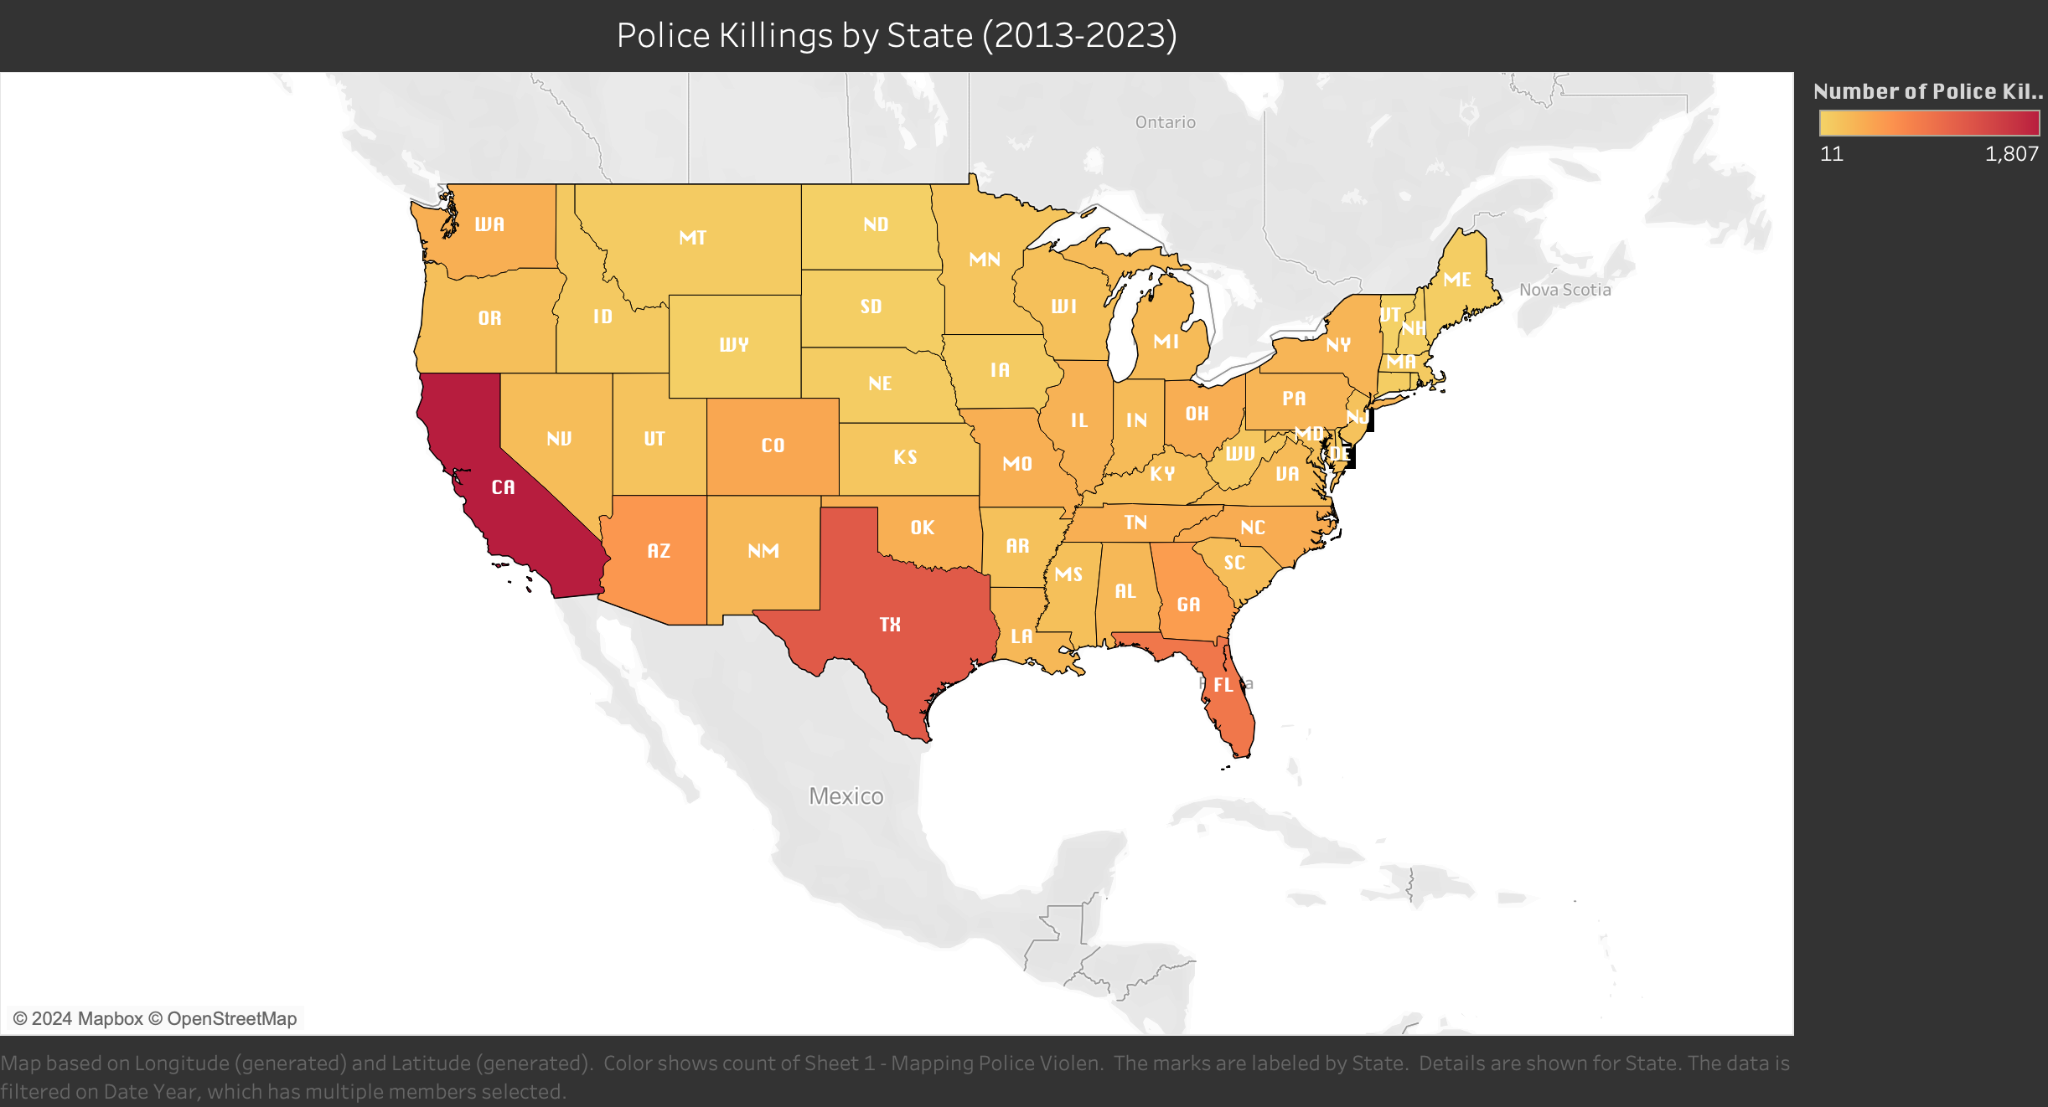
- The states with the highest number of police killings are California and Texas.
This data on police killings in the US has continuously been tracked since 2013 and suggests that among other races, white people are killed in the greatest quantities. However, white individuals are the largest population sub-group in the country. With that being said, in 2023 23.5% of victims were Black, yet Black Americans only make up 14% of the country’s population.

Stephanie Lessing, professor of political science at Northeastern University and doctoral candidate in public policy, says that no police departments have been dismantled since calls in 2020, despite an attempt in Minneapolis. However, other sizeable movements have been made to improve law enforcement accountability.
“On a national level, there is a pretty sizeable movement known as #8 Can't Wait. It’s these eight fundamental police reforms that have come about since 2020,” said Lessing. “Some of them, the notable ones, have to do with how police officers use force.”
Lessing says that the reforms include the use of neck restraints or chokeholds, the implementation of de-escalation training that trains officers to look for alternatives to using deadly force, and better reporting methods within individual police departments. Although these changes are significant, she says that improvements are still needed.
The impassioned outcry of “Black Lives Matter” that echoed through American streets in 2020 brought attention to the enduring crisis of systemic racism and police violence in the United States. But the data speaks volumes about the lack of substantial progress in curbing police killings.
The statistics underscore the disproportionate impact on Black Americans and the need for reform. While initiatives such as #8 Can’t Wait signal steps toward accountability and restraint, they remain insufficient in addressing the deeply rooted issues within law enforcement. It is evident that work for racial justice organizations still lies ahead to create a truly equitable society.
METHODS:
The data used to create this article was sourced from Mapping Police Violence, a non-profit research organization that publishes data surrounding every logged police killing in the United States.
To examine the data, I first cleaned the provided data through Excel to only view the columns detailing race, city, state, cause of death, signs of mental illness, allegedly armed, what weapon they were armed with, if the victim fleed, and encounter type. I used the data visualization tool Tableau to create my graphs and maps.
The first visualization I created to examine the data was a bar chart that visualizes the increase in the number of police killings from the year 2013 to 2023. Through analyzing this chart, it is evident that the number of police killings has increased slowly during these ten years.
The second visualization I created was a map of the United States, colored according to the number of police killings in each state. This map shows the viewer that California and Texas had the highest number of police killings during the ten years, however, these states have the highest populations in the country.
The third visualization I created was a bar chart of police killings by race. This chart demonstrates that the greatest number of police killings was among white individuals, followed by Black, Hispanic, Asian, Native American, and Native Hawaiian & Pacific Islander.
Additionally, in order to explore the difference in the percentage of police killings of Black people in Texas in 2020 and the Black population in 2020, I created a pivot table in Excel. The calculations were additionally done through Excel.


Post a comment